Decision Support for Climate Adaptation Planning

EClim Group, Department of Geography, University of Zurich
Description
DSS_Embrace is a collaborative environment to embrace deep uncertainties in decision making on climate risks. Deep uncertainties often involve high stakes decisions, unique situations, long-term planning, or situations where the future may be fundamentally different from the past. In dealing with deep uncertainties, experts employ various methods and approaches to enhance decision-making and strategic planning. These include scenario analysis, modeling, simulation, Bayesian approaches, expert opinions, sensitivity analysis, and learning from parallel fields or historical analogies. DSS_Embrace uses the so-called exploratory modelling framework where decision makers are confronted with several possible climate realisations and policy combinations. The climate realisations are the results of climate models, interannual climate variability and climate scenarios, whereas the policies represent the effect of potential adaptation measures. Adaptation pathways provide a flexible and dynamic approach to decision-making that can be adjusted over time as new information becomes available. Here, we sow some illustrative adaptation pathways to link the climate realisations-policies figure with concrete actions on the ground. DSS_Embrace is co-financed by the Digital Initiative Zurich (DIZH) and the EClim Group at the Department of Geography.
For more details please see the research article at https://doi.org/10.1016/j.wace.2022.100501.
Zürich, Historical Data
The graph depicts the yearly number of observed concurrent hot days (28°C–35°C) and nights (15°C–20°C) in Zurich from 1981 to 2020 and the impact of different adaptation policies. The lines represent the number of hot days and nights that exceed the thresholds. These lines depict the combination of observed hot day and night extremes and the effect of adaptation policies to alleviate such extremes. Stringent policies are those leading to extremes below and up to the black line, more relaxed policies fall between the yellow and pink lines and little to now adaptation policies fall above the pink line. From the graph, it can be inferred that even in the years 2003 and 2015 the number of concurrent hot days and nights extremes could have been considerably reduced.
Climate Scenarios
Scenario “low global warming”
The first figure shows the yearly projected number of concurrent hot days and nights in Zurich until the end of the century under a scenario of low global warming (i.e. in the order of 1.8°C temperature increase by the end of the century above the period 1850-1900). The threshold for hot days is in the range 28°C–35°C and for hot nights is in the range 15°C–20°C. The lines represent the number of hot days and nights that exceed the thresholds. These lines depict the combination of future hot day and night extremes and the effect of adaptation policies to alleviate such extremes. Stringent policies are those leading to extremes below and up to the black line, more relaxed policies fall between the yellow and pink lines and little to now adaptation policies fall above the pink line. The second figure shows the statistical distribution of the number of hot days and nights per decade using boxplots. The figure on below should be understood as a metro map. The metro lines represent alternative sequences of adaptation measures that can be taken over time. The black circle depict the beginning of the metro line as well as the transfer to another line. The bar means that the pathway has become ineffective to alleviate the impacts of extremes.
Adaptation Pathways
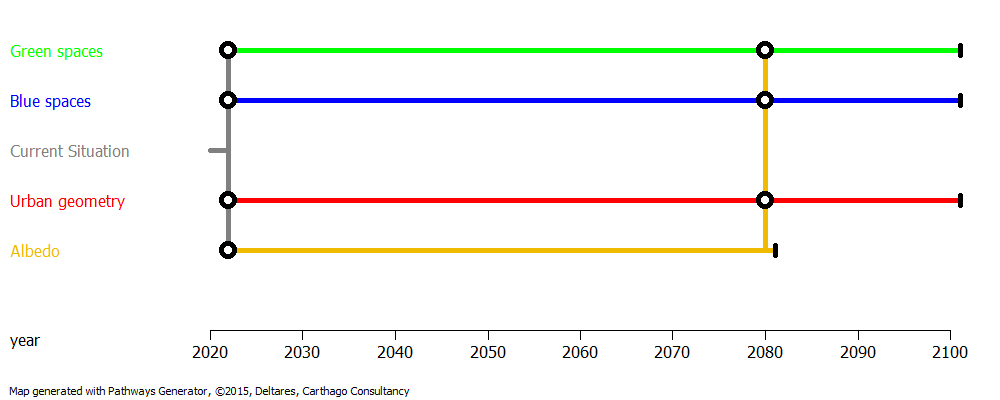
HHWS = Heat health early warning systems (HHWS) are adaptation measures that provide timely information to protect populations from the health risks of extreme heat events.
Albedo = Increase of the reflection of solar radiation (e.g. by white pavements, roofs)
Urban geometry = Change the layout of house constructions, street orientations, and building heights
Blue Spaces = more water bodies, porous surfaces, fountains
Green spaces = more trees, green roofs/facades
Scenario “medium global warming”
The first figure shows the yearly projected number of concurrent hot days and nights in Zurich until the end of the century under a scenario of medium global warming (in the order of 2.7°C temperature increase by the end of the century above the period 1850-1900). The threshold for hot days is in the range 28°C–35°C and for hot nights is in the range 15°C–20°C. The lines represent the number of hot days and nights that exceed the thresholds. These lines depict the combination of future hot day and night extremes and the effect of adaptation policies to alleviate such extremes. Stringent policies are those leading to extremes below and up to the black line, more relaxed policies fall between the yellow and pink lines and little to now adaptation policies fall above the pink line. The second figure shows the statistical distribution of the number of hot days and nights per decade using boxplots. The figure below should be understood as a metro map. The metro lines represent alternative sequences of adaptation measures that can be taken over time. The black circle depict the beginning of the metro line as well as the transfer to another line. The bar means that the pathway has become ineffective to alleviate the impacts of extremes.
Adaptation Pathways
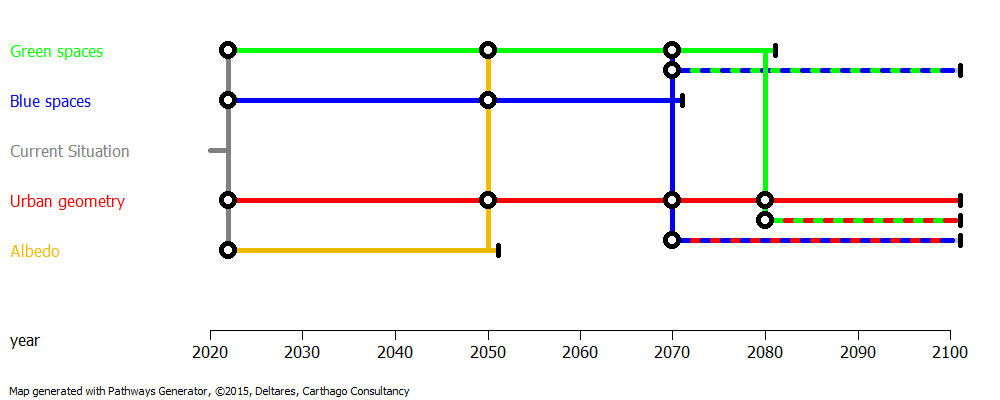
HHWS = Heat health early warning systems (HHWS) are adaptation measures that provide timely information to protect populations from the health risks of extreme heat events.
Albedo = Increase of the reflection of solar radiation (e.g. by white pavements, roofs)
Urban geometry = Change the layout of house constructions, street orientations, and building heights
Blue Spaces = more water bodies, porous surfaces, fountains
Green spaces = more trees, green roofs/facades
Scenario “high to very high global warming”
The first figure shows the yearly projected number of concurrent hot days and nights in Zurich until the end of the century under a scenario of high to very high global warming (e.g. more than 4°C temperature increase by the end of the century above the period 1850-1900). The threshold for hot days is in the range 28°C–35°C and for hot nights is in the range 15°C–20°C. The lines represent the number of hot days and nights that exceed the thresholds. These lines depict the combination of future hot day and night extremes and the effect of adaptation policies to alleviate such extremes. Stringent policies are those leading to extremes below and up to the black line, more relaxed policies fall between the yellow and pink lines and little to now adaptation policies fall above the pink line. The second figure shows the statistical distribution of the number of hot days and nights per decade using boxplots. The figure below should be understood as a metro map. The metro lines represent alternative sequences of adaptation measures that can be taken over time. The black circle depict the beginning of the metro line as well as the transfer to another line. The bar means that the pathway has become ineffective to alleviate the impacts of extremes.
Adaptation Pathways
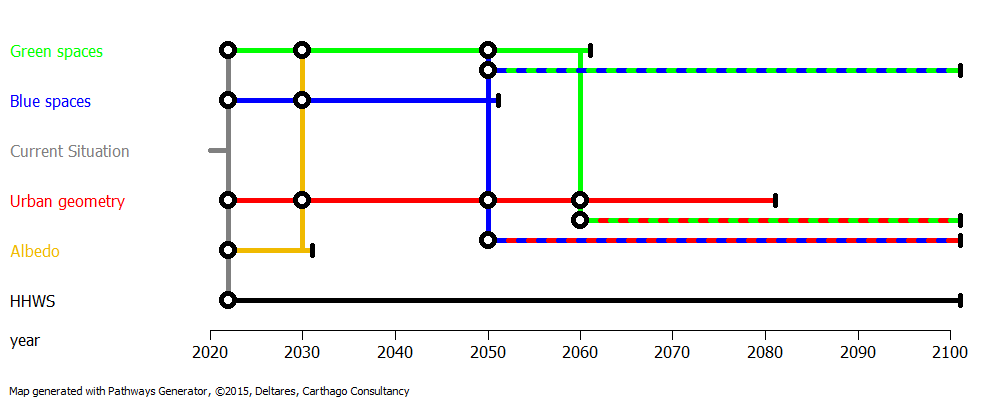
HHWS = Heat health early warning systems (HHWS) are adaptation measures that provide timely information to protect populations from the health risks of extreme heat events.
Albedo = Increase of the reflection of solar radiation (e.g. by white pavements, roofs)
Urban geometry = Change the layout of house constructions, street orientations, and building heights
Blue Spaces = more water bodies, porous surfaces, fountains
Green spaces = more trees, green roofs/facades
Relative importance of determinants for decision-making
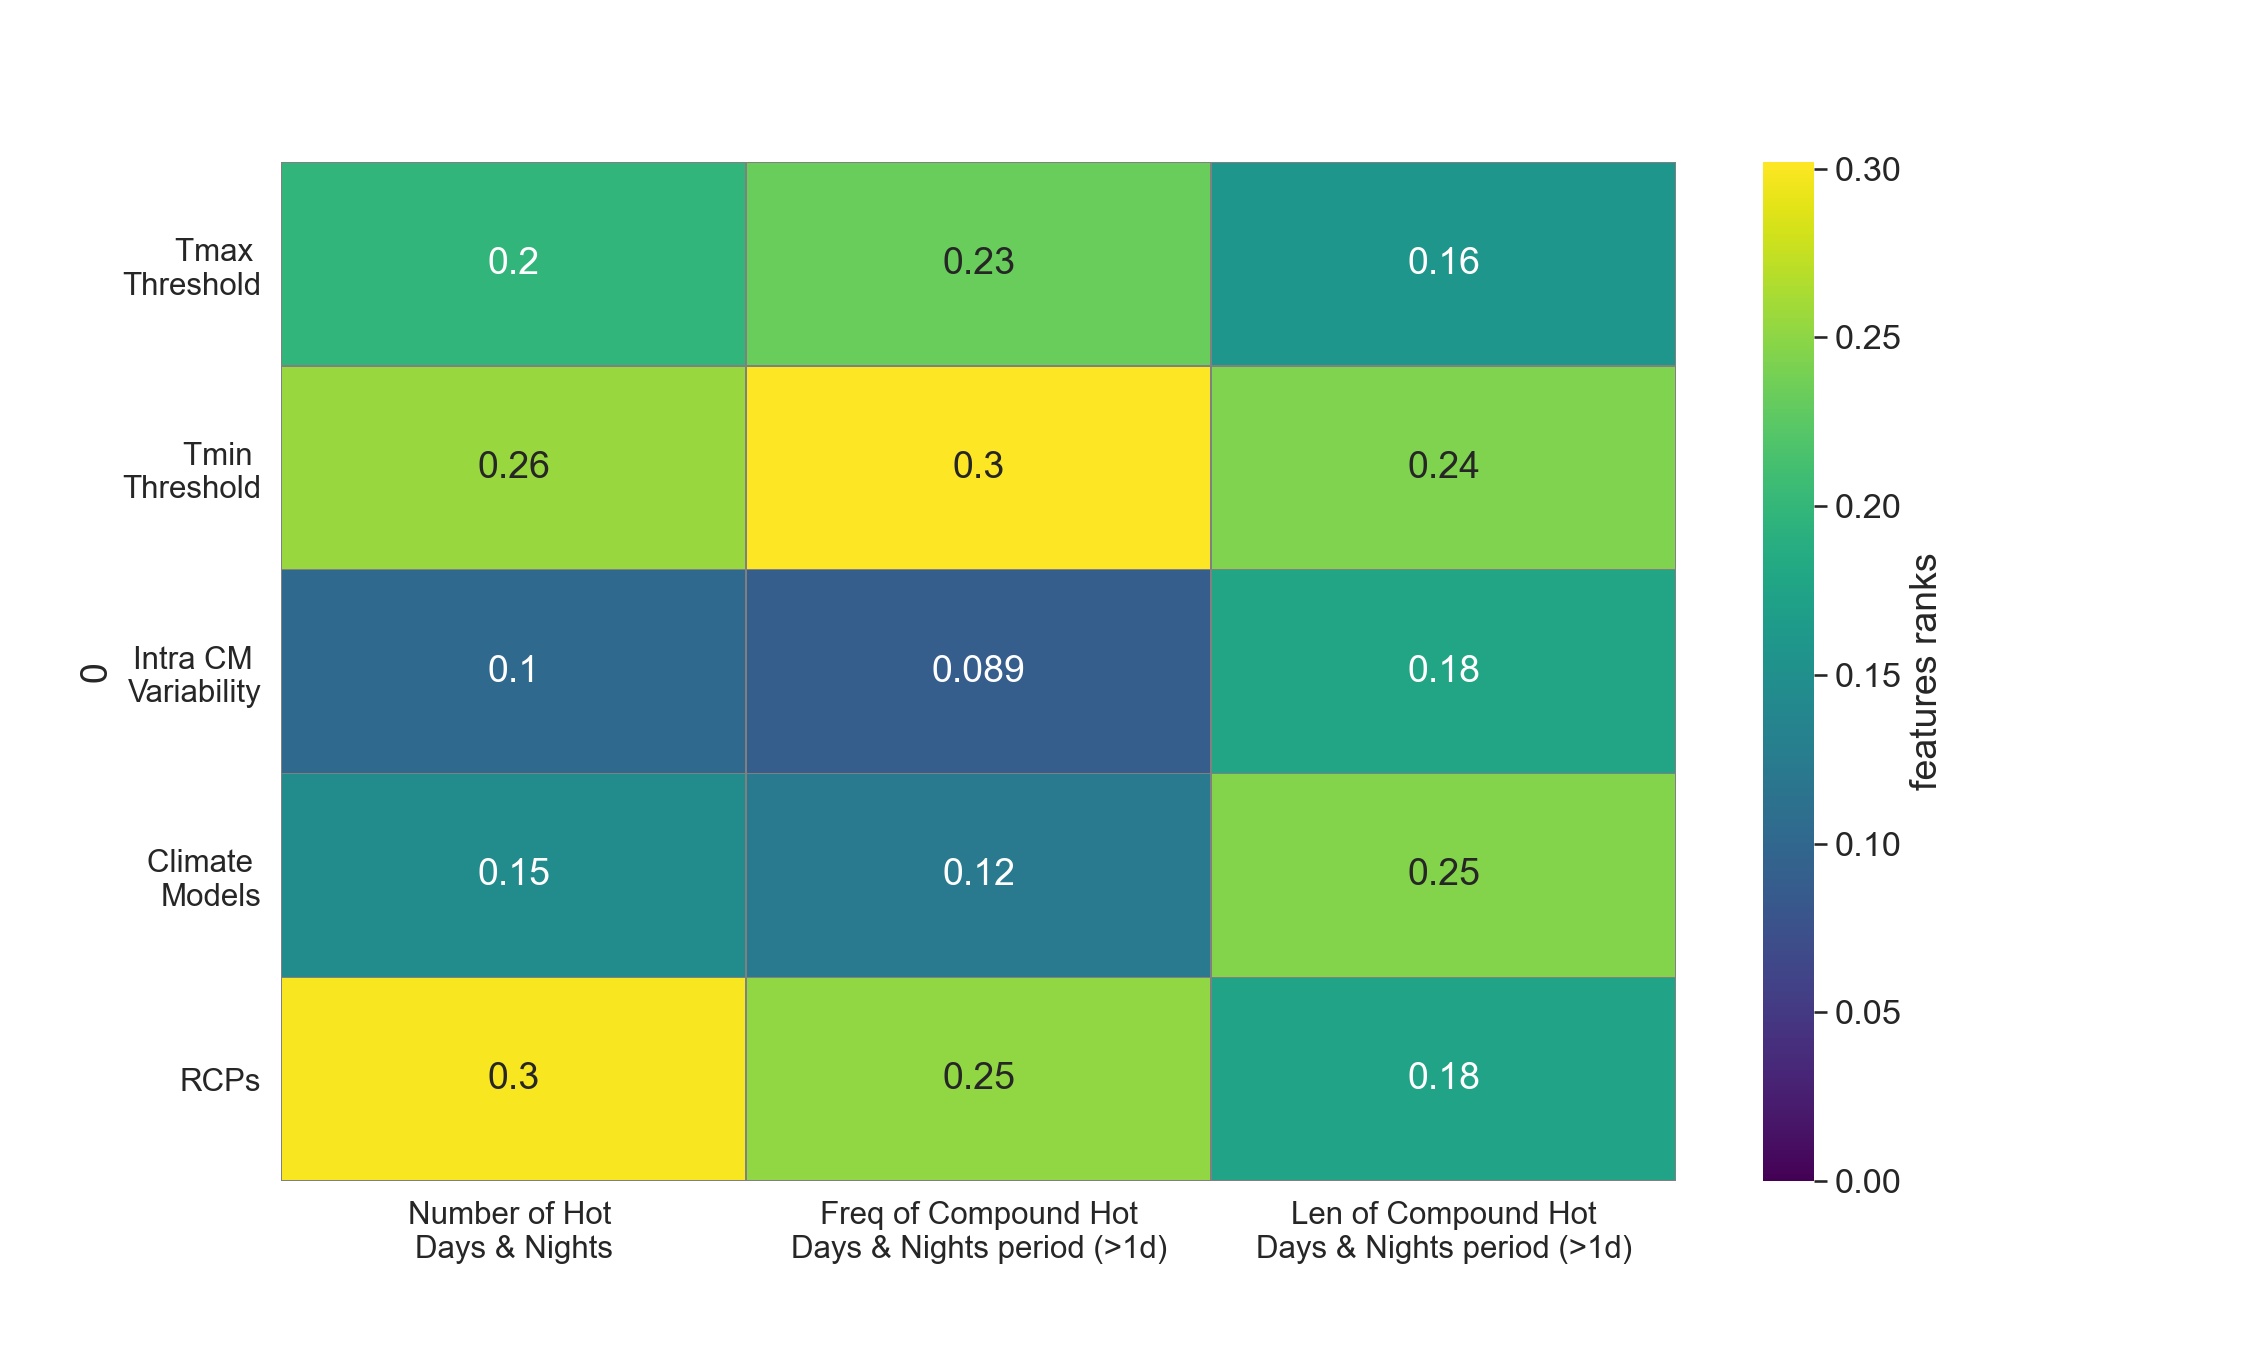
Feature scoring analysis showing the relative importance of the choice of climate scenarios (RCPs), climate model (Climate Models), intra-climate model variability (Intra CM variability), thresholds of minimum temperature (Tmin) and thresholds of minimum temperature (Tmax) for the outcomes. The outcomes are the number of concurrent hot days and nights, their frequency and length. Higher numbers and bright colours indicate higher importance.
Leave a Reply
You must be logged in to post a comment.